Integrations
Using RSyslog to monitor and forward log files to QRadar
Although it is possible to use SSH/SFTP/SCP to collect log files with QRadar, that option may not be the most appropriated for every company. Those collection methods, called pull-collection, requires an extra account in the system (so QRadar can login to collect the log). Moreover, the pull-collection methods collect the logs in an interval (usually, 5 minutes), meaning that logs may take up to 5 minutes to arrive in QRadar.
One alternative for collecting logs stored in files is using the rsyslog service, which is already pre-installed in the majority of the RedHat and CentOS versions. Those services are able to monitor a log file and forward each new log line to QRadar.
The first step is to check which version of rsyslog you have:
$ rsyslogd -version
If you have the newer rsyslog versions (7.x or above), then edit the /etc/rsyslog.conf file and add the following lines:
#### Load the file reader module ####
module(load="imfile" PollingInterval="10")

#### Configure to read a file ####
input(type="imfile" File="/var/log/logfile1.log"
Tag="LogFileName:"
StateFile="/var/spool/rsyslog/state-LogFileName"
Severity="info"
Facility="local3")

#### Forward the logs to QRadar
local3.info @@qradar_ip_address:514
If you have the legacy versions (5.x or below), then edit the /etc/rsyslog.conf file and add the following lines:
##### Load file reader module #######
$ModLoad imfile

##### Configure to read a file ########
$InputFileName /var/log/logfile1.log
$InputFileTag LogFileName:
$InputFileStateFile state-LogFileName
$InputFileSeverity info
$InputFileFacility local3
$InputRunFileMonitor

##### Set the file monitoring for every 10 seconds ######
$InputFilePollInterval 10

##### Forward logs in local3.info to Qradar #######
local3.info                     @@qradar_ip_address:514
After the changes being done on the rsyslog.conf file, all you have to to is restart the service:
$ systemctl stop rsyslog
$ systemctl start rsyslog
To check if the service was started without errors, check the status by:
$ systemctl status rsyslog
If everything worked well, your service should be started without any errors.
One very common issue is when the rsyslog is not able to access the log file. This usually happens due to the SELinux service, which blocks access to sensitive files on the machine. To check if that is the case, temporarily disable the SELinux by using the following command:
$ setenforce 0
After that, restart rsyslog and check if the error persist. If it the issue is solved, then all you have to do is adding an exception to your SELinux to allow rsyslog to access the specific log file.
Using Syslog-ng to monitor and forward log files to QRadar
Although it is possible to use SSH/SFTP/SCP to collect log files with QRadar, that option may not be the most appropriated for every company. Those collection methods, called pull-collection, requires an extra account in the system (so QRadar can login to collect the log). Moreover, the pull-collection methods collect the logs in an interval (usually, 5 minutes), meaning that logs may take up to 5 minutes to arrive in QRadar.
One alternative for collecting logs stored in files is using the syslog-ng service, which is already pre-installed in the majority of the newer Linux releases. This service can be used to monitor a specific file (in smaller intervals, such as 10 seconds) and in case of any changes, send the logs to QRadar. The configuration is fairly simple, here are the steps:
- Check if the syslog-ng is installed:
$ service syslog-ng status
if not installed, install using:
$ apt-get install syslog-ng
- Edit the syslog-ng configuration file (usually at: /etc/syslog-ng/syslog-ng.conf), inserting the following lines:
source s_logfile1 {
file("[[[PATH_TO_FILE]]]" follow_freq(10) flags(no-parse));
};

destination d_qradar {
tcp("[[[QRADAR_COLLECTOR_IP]]]" port(514) template("<$PRI>$DATE $HOST $MESSAGE\n"));
};

log {
source(s_logfile1);
destination(d_qradar);
};
The first line adds a “file monitoring” rule to the specific file. You can update the file monitoring frequency (in seconds) by changing the follow_freq parameter.
The second line adds a syslog destination, if you already had syslog-ng configured for another log monitoring, this line may not be necessary.
The third line adds a logging action from the source file to the destination syslog recipient. - Restart the syslog-ng service
$ service syslog-ng restart
- Done! You can now check on QRadar if logs are coming.
- If you need to troubleshoot, you can check the syslog-ng logs by using the following commands:
$ syslog-ng
$ service syslog-ng status
Monitoring Software-as-a-Service (SaaS) cloud solutions with QRadar
One of the big advantages of having a Software-As-A-Service (SaaS) solution is the fact you don’t need to worry about infrastructure issues, such as patching, network availability, and etc. Also, most of the companies assume that all the security aspects of the solution will be handled by the vendor. Indeed, the vendor is (or should be) responsible for ensuring their system is secure, but it’s important to note that we should still monitor the SaaS solution for hacking attempts, which can be done through QRadar.
Picture this: imagine you have your website on wordpress, you pay wordpress as a service so you don’t need to worry about patching or updates. In theory, the wordpress team also monitors if someone tries to perform an attack against your site (for example, a SQL injection). But let’s say a malicious actor finds out the password of one of your wordpress users and creates a backdoor account for later exploitation. It wouldn’t be flagged by the wordpress security team (since it’s just a new user being created). That’s where QRadar can add value. If you integrate your wordpress with your QRadar solution, you would be able to generate an alert to your system administrator when a user is created or even correlate this event with other events such as pages being modified.
The easiest way to integrate your SaaS with QRadar is through email alerts from your SaaS solution. Let’s take the WordPress example and put it into a step-by-step:
- Install the WordPress “Security Audit log” plugin
- Create a mailbox to receive the alerts
- Create a script that reads your mailbox and saves into a file. For example, you can modify this script to achieve that.
- Create a custom DSM parser that interprets the file generated by the script above.
- Create a log source on QRadar that monitors the file created by the script mentioned on step three. Use the custom DSM on this log source.
The implementation may require some time in the first time, but after setting up your first SaaS it will be trivial to set up the second one (since you will already have the mailbox set up and the script that reads the file). The same step by step can be adapted for a number of other SaaS services, such as: Dropbox, Gmail, Office365, Salesforce, AWS Cloudtrail and CloudWatch, etc…
Some of the events that can be interesting for us: New accounts created, change on security settings, login out of business hours, bruteforce attacks, configuration changes, etc.
Monitoring your SaaS solutions will put you one step ahead, ensuring that even applications on the cloud are being monitored and secure. Remember, even the server not being in your datacentre, the data in a SaaS application still yours.
Monitoring Cloud Servers with QRadar
Cloud computing is an inevitable upward trend. Companies are looking for all the benefits cloud computing, such as cost effectiveness and scalability, but they may be neglecting the need of event monitoring in a cloud environment.
Configuring a SIEM solution to collect events from servers in a cloud environment may be simpler than you think. Cloud servers are still servers, meaning that they produce logs and events as any in-house server. In this post we will be discussing few strategies and architectures to consider when planning a QRadar implementation with servers in the cloud.
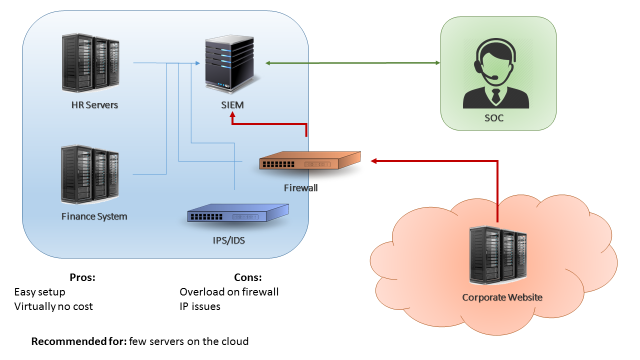
The first scenario is when you have just few servers in the cloud (less than 15% of your environment, or less than 500EPS coming from the cloud). A easy approach for this scenario can be simply configuring your cloud servers to send logs to your existing in-house QRadar collector (Figure 1). This can be accomplished by using a VPN between your cloud environment and your datacentre, or by configuring your firewalls to allow your cloud servers to send logs directly to your in-house collector. The benefits in this case are the fact that is a very easy setup and there’s virtually no costs. The downside on this design is that if your server generate a high number of events, your firewall/VPN could be overloaded.
The second scenario is when you have a substantial amount of servers in the cloud (between 30%-40% of your environment, or less than 5000 EPS). In this case, if you try to send all your events directly through a firewall or VPN you may overload the border network devices of your environment. The recommended approach in this case would be implementing a virtual collector/processor in your cloud environment (Figure 2). The cloud servers would send logs to your virtual collector/processor, which will parse the data locally and compress it before sending to the in-house SIEM collector. This architecture benefits from the fact that you will have an increased EPS capacity. Also, if your VPN dies or if the network is unstable you don’t lose events due to the fact the collector buffers the logs locally. In other hand, this architecture will have an extra cost (the additional collector) and, even with the traffic being compressed, it still may affect your firewall/VPN performance in case you’re monitoring a large quantity of servers.

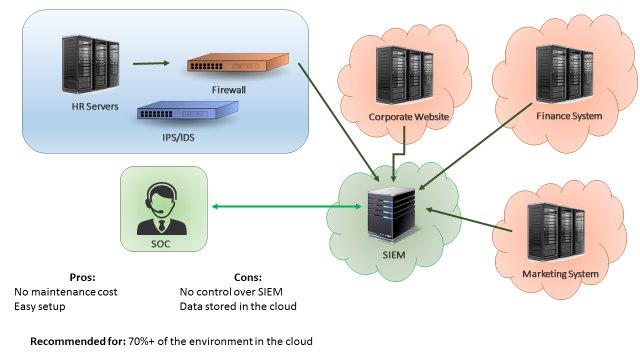
The third scenario is when most of your servers are in the cloud. In this case, a good approach would be having QRadar collectors (or even your whole QRadar infrastructure) deployed on the cloud, as seen on Figure 3. In this way, your border network devices will not be overloaded by logs sent from cloud servers to your internal SIEM. A similar approach would be having “QRadar as service”, which is a service from IBM where all the SIEM infrastructure is taken care by the IBM team. The advantages of having SIEM as a service is that you don’t need to worry about the SIEM maintenance and there’s little to none setup effort. The disadvantages is that your data will be stored in the IBM cloud environment, which for some companies may not be adequate.
Those are the three most common approaches when monitoring cloud servers with a SIEM solution. It is important to remember that each case is a case, meaning that each company should analyse their current and future environment before designing a SIEM implementation. You may find that a combination of the presented approaches may suit best your needs. The most important thing is remembering that monitoring servers in the cloud is as important as monitoring in-house servers.
