Administration
Monitoring Cloud Servers with QRadar
Cloud computing is an inevitable upward trend. Companies are looking for all the benefits cloud computing, such as cost effectiveness and scalability, but they may be neglecting the need of event monitoring in a cloud environment.
Configuring a SIEM solution to collect events from servers in a cloud environment may be simpler than you think. Cloud servers are still servers, meaning that they produce logs and events as any in-house server. In this post we will be discussing few strategies and architectures to consider when planning a QRadar implementation with servers in the cloud.
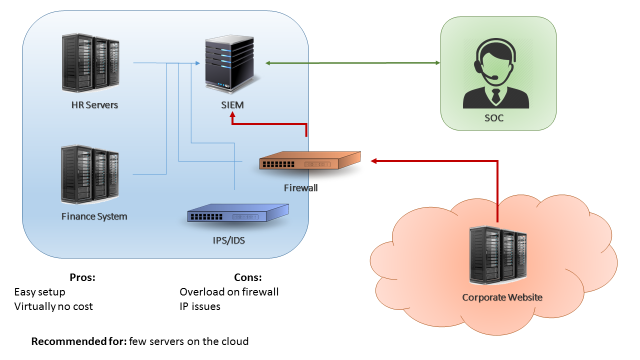
The first scenario is when you have just few servers in the cloud (less than 15% of your environment, or less than 500EPS coming from the cloud). A easy approach for this scenario can be simply configuring your cloud servers to send logs to your existing in-house QRadar collector (Figure 1). This can be accomplished by using a VPN between your cloud environment and your datacentre, or by configuring your firewalls to allow your cloud servers to send logs directly to your in-house collector. The benefits in this case are the fact that is a very easy setup and there’s virtually no costs. The downside on this design is that if your server generate a high number of events, your firewall/VPN could be overloaded.
The second scenario is when you have a substantial amount of servers in the cloud (between 30%-40% of your environment, or less than 5000 EPS). In this case, if you try to send all your events directly through a firewall or VPN you may overload the border network devices of your environment. The recommended approach in this case would be implementing a virtual collector/processor in your cloud environment (Figure 2). The cloud servers would send logs to your virtual collector/processor, which will parse the data locally and compress it before sending to the in-house SIEM collector. This architecture benefits from the fact that you will have an increased EPS capacity. Also, if your VPN dies or if the network is unstable you don’t lose events due to the fact the collector buffers the logs locally. In other hand, this architecture will have an extra cost (the additional collector) and, even with the traffic being compressed, it still may affect your firewall/VPN performance in case you’re monitoring a large quantity of servers.

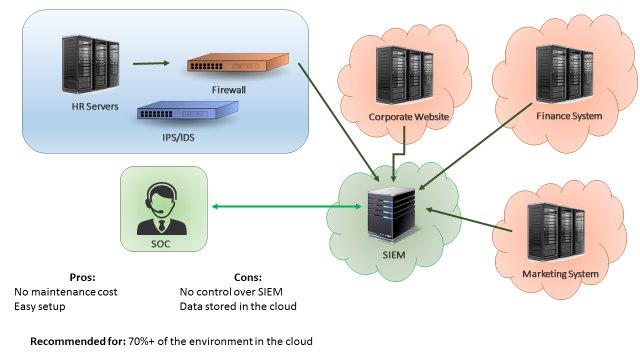
The third scenario is when most of your servers are in the cloud. In this case, a good approach would be having QRadar collectors (or even your whole QRadar infrastructure) deployed on the cloud, as seen on Figure 3. In this way, your border network devices will not be overloaded by logs sent from cloud servers to your internal SIEM. A similar approach would be having “QRadar as service”, which is a service from IBM where all the SIEM infrastructure is taken care by the IBM team. The advantages of having SIEM as a service is that you don’t need to worry about the SIEM maintenance and there’s little to none setup effort. The disadvantages is that your data will be stored in the IBM cloud environment, which for some companies may not be adequate.
Those are the three most common approaches when monitoring cloud servers with a SIEM solution. It is important to remember that each case is a case, meaning that each company should analyse their current and future environment before designing a SIEM implementation. You may find that a combination of the presented approaches may suit best your needs. The most important thing is remembering that monitoring servers in the cloud is as important as monitoring in-house servers.
Detecting ransomware with QRadar using behavioral analysis
Ransomware is one of the top trending concerns in any business; hundreds of business are seeing their data being encrypted even with the latest security solutions. As most of anti-virus solutions are signature based, they are not fully capable of detecting the latest ransomware strains. In this post we will be discussing how to configure QRadar to detect ransomware threats in real time by observing events’ behaviour.
Ransomware may seem a complex attack, but most of them are actually quite simple: The malware encrypts files and then shows a ransom message to the user. The objective of the attacker is to encrypt the files as fast as possible to maximize the impact (if the encryption is slow the user may notice and stop the attack before all the files gets encrypted), and that’s how we can detect the threat.
In a simple language, the encryption process consists in: open a file, read a file, write the encrypted file, close the file. If you are monitoring your servers with QRadar, every time a file is updated an event is generated. So if you detect a high volume of “file update” events in a short period of time, it may be a sign of a ransomware infection.
Based on that, to implement an effective ransomware monitoring capability on QRadar all you need to do is:
- Ensure file audit is enabled on your windows servers: You need to be able to see events such as “File open”, “File Update” and “File Delete”. Before creating any rule, search for those event names to make sure you are getting them. Please note that this can considerably increase your EPS rate, so if you have a large environment and you’re enabling file-access audit consider enabling it in stages and observing your EPS rate.
- Create an offense rule that detect multiple file updates: A good threshold is 500 file updates in a minute. If you see more than 500 file updates in less than a minute, that’s an indication that there is an automated process updating your files (which may be a sign of ransomware).
If you have any mitigation system (such as IBM BigFix or McAfee EPO), you can even trigger a mitigation action to stop the ransomware. For example with QRadar you can send a “process kill” request to IBM BigFix, which will quickly login into the machine and kill the ransomware process.
It is important to note that QRadar is detecting ransomware through system behaviour. This puts QRadar in advantage if compared to regular signature-based anti-virus solutions, since we will be capable of detecting “zero-day” ransomware, which anti-virus solutions may not have signature for it.
This post is based on a very interesting video series called “QRadar Stopping Ransomware” by Jose Bravo. If you want to see step-by-step of how to configure your SIEM to stop ransomware, you should check out his youtube channel.
Proactively identifying performance issues with the HCF plugin
In the last post, we talked about the Health Check Framework (HCF) and its benefits. Since I’ve been using the plugin for over a month I was able to collect useful performance information and identify some potential performance issues even before they occur. In this post, you will learn how to proactively monitor your system performance and prevent potential performance issues from happening.
First, you will need to install the Health Check Framework plugin. The installation process is quite straightforward: all you need is to go to your IBM app store on your QRadar environment, search for “Health Check Framework” and install it following the steps on the screen. With the plugin installed, you can start by browsing the plugin interface and extracting a report about your system performance. In this report, you will see a lot of details about your system, such as CPU Usage, Disk Usage, EPS, FPM, heavy reports, current users, etc.

In my case, we are planning to expand the scope of servers monitored by QRadar, so I wanted to understand if we would need any hardware upgrades. For testing purposes, I disabled the log collection of 30 Windows servers that were currently being monitored and I noticed that the RAM memory usage reduced by around 5% (see images below). Obviously, this number will vary according to the server usage, but this test gave me a rough estimation that for each 30 servers my RAM memory usage will increase around 5%. So with the help of the HCF plugin, I was able to identify hardware upgrades to accommodate the monitoring of new servers, avoiding system outages due to lack of resources during the scope expansion.


Even if you’re not planning to expand your scope, you can use historical performance data to proactively identify issues. For example, let’s say, your QRadar monitors a new e-commerce website. The number of logs you get depends on the traffic your website has. With the historical data, you will be able to identify a performance trend: as the e-commerce website becomes more popular, the EPS increases and the CPU/Memory usage also increases. With this data, you will be able to estimate at which point in time you will need a hardware upgrade, avoiding any unexpected system outages due to lack of resources.
Another very interesting data that I found in this report was the “Event Average Payload Size”, which as the name says, tells you the average size of logs received. This can be very useful to identify hard drive requirements when expanding your EPS.
Using the same plugin I was also able to identify heavy reports and rules that were severely impacting the performance of my QRadar environment. After reviewing and fixing the queries of the reports and rules, it was noticed a considerable reduction in the CPU usage.

Monitoring the performance of your system puts you in a proactive posture in relation to your environment. Being proactive means that you will not be firefighting issues as before, but instead, monitoring and planning upgrades ahead to avoid issues even before they happen.
QRadar New Features (7.2.5 – 7.2.7)
Since my last post several new features were introduced on QRadar. In the last couple of years, IBM is really trying to stay ahead of its competitors (and also trying to catch up and in some forgotten features). In this post I want to discuss about the new capabilities that I believe are significant improvements in the new versions of QRadar (7.2.5 – 7.2.7).
- Multitenancy: Probably the feature that all the SOC service providers were waiting for. Now it’s possible to have multiple clients in one single QRadar installation, meaning that if you monitor QRadar for more than one company now you can see all your clients in one single dashboard. This feature also allow you to assign a specific amount of EPS for each tenant, making it easy to control the SIEM usage for each client. There’s a lot of improvements with this feature, so if you want more information just check the official IBM video about this feature.
- Historical Correlation: Several times in the past I struggled with the fact it was not possible to apply a new offense rule to past events. I had to use several bash tricks to be able to replay logs. However, in the latest versions of QRadar it is possible to “replay” historical logs to figure out if your new offense rule happened in the past. IBM also has a good video about this topic.
- Deployment Editor: Finally IBM got rid of the java applet that managed the QRadar deployment. The new QRadar 7.2.7 allows you to manage your appliances through the web interface!
- Custom Action Scripts: This is a feature that can be powerful if well written or dangerous if misconfigured. It can be powerful because allow an offense to trigger any action on an external system, for example, allow you to write an script that creates a new firewall rule if an “brute-force offense” is observed. At same time this is a great feature, the pentester side of me can see a lot of potential vulnerabilities with this feature: basically you’re allowing an script to execute a command in a server based on an input of a log received from a non-trusted device, meaning that if someone properly craft a syslog, they may be able to inject a command into your script. It’s not easy, but it may be possible. So make sure you properly sanitize the inputs in your action script. Also, make sure you properly configure the access to the script file (since it probably will contain access keys to other systems)
- Data Obfuscation: This feature basically obfuscate sensitive data coming in the logs. For example: let’s say that your application use as user-id the credit card number of the customer (which is NOT recommended), then your application sends the user-id to QRadar as part of the logs of some action. With this feature, you can obfuscate the user-id to ensure your SOC team will NOT see the credit card number of your customers. Check this IBM video for more information, they discuss where you can apply data obfuscation and where you shouldn’t apply it.
There are several other new features in the new QRadar versions but the above are the ones that in my opinion really aggregated value to the tool! Check out the IBM channel on Youtube, you can find several videos about the new QRadar features! What is your favorite new QRadar feature?
- ← Previous
- 1
- 2
- 3
- …
- 5
- Next →
